What we saw already
At Fs = 48 kS/s and f = 24 kHz, the point turns by exactly 180° in each interval between measurements. For a cosine with amplitude 1:
| Initial phase | First four samples |
|---|---|
| 0° | 1, −1, 1, −1 |
| 60° | 0.5, −0.5, 0.5, −0.5 |
| 90° | 0, 0, 0, 0 |
The physical amplitude is the same in all three rows. The difference is where the sampling instants fall. With a phase of 90°, the signal reaches its maximums between the samples, and the ADC sees zero each time.
In NumPy, we give the phase in radians: np.pi / 2 or np.deg2rad(90). The number 90 means 90 radians and gives a very different result. A small remainder near mathematical zero in float64 is computational rounding.
One formula explains all three cases
At the limit f = Fs/2:
Expand the cosine of the sum:
For an integer n, always , and . So:
The full record has the form C, −C, C, −C, …. It keeps only one number, C — the product of the amplitude and the cosine of the phase. Without more information, you cannot recover A and φ separately from this record.
This is not a random ADC error: even ideal samples do not contain sufficient information.
Ambiguity also occurs without zeros
Compare two signals at Fs/2:
- A = 1, φ = 60° → C = 1 · 0.5 = 0.5;
- A = 0.5, φ = 0° → C = 0.5 · 1 = 0.5.
Both give 0.5, −0.5, 0.5, −0.5, …. From the array, you cannot find which amplitude was at the input. And C = 0 can mean that there is no signal, or that there is a non-zero cosine with a phase of 90°.
On the circle, we always see only two opposite points. A longer record does not add new positions.
Lab: compare phases and frequencies
The script plots samples for the phases 0°, 60° and 90° and checks the example with two different amplitudes.
uv run labs/01/03-nyquist.py --show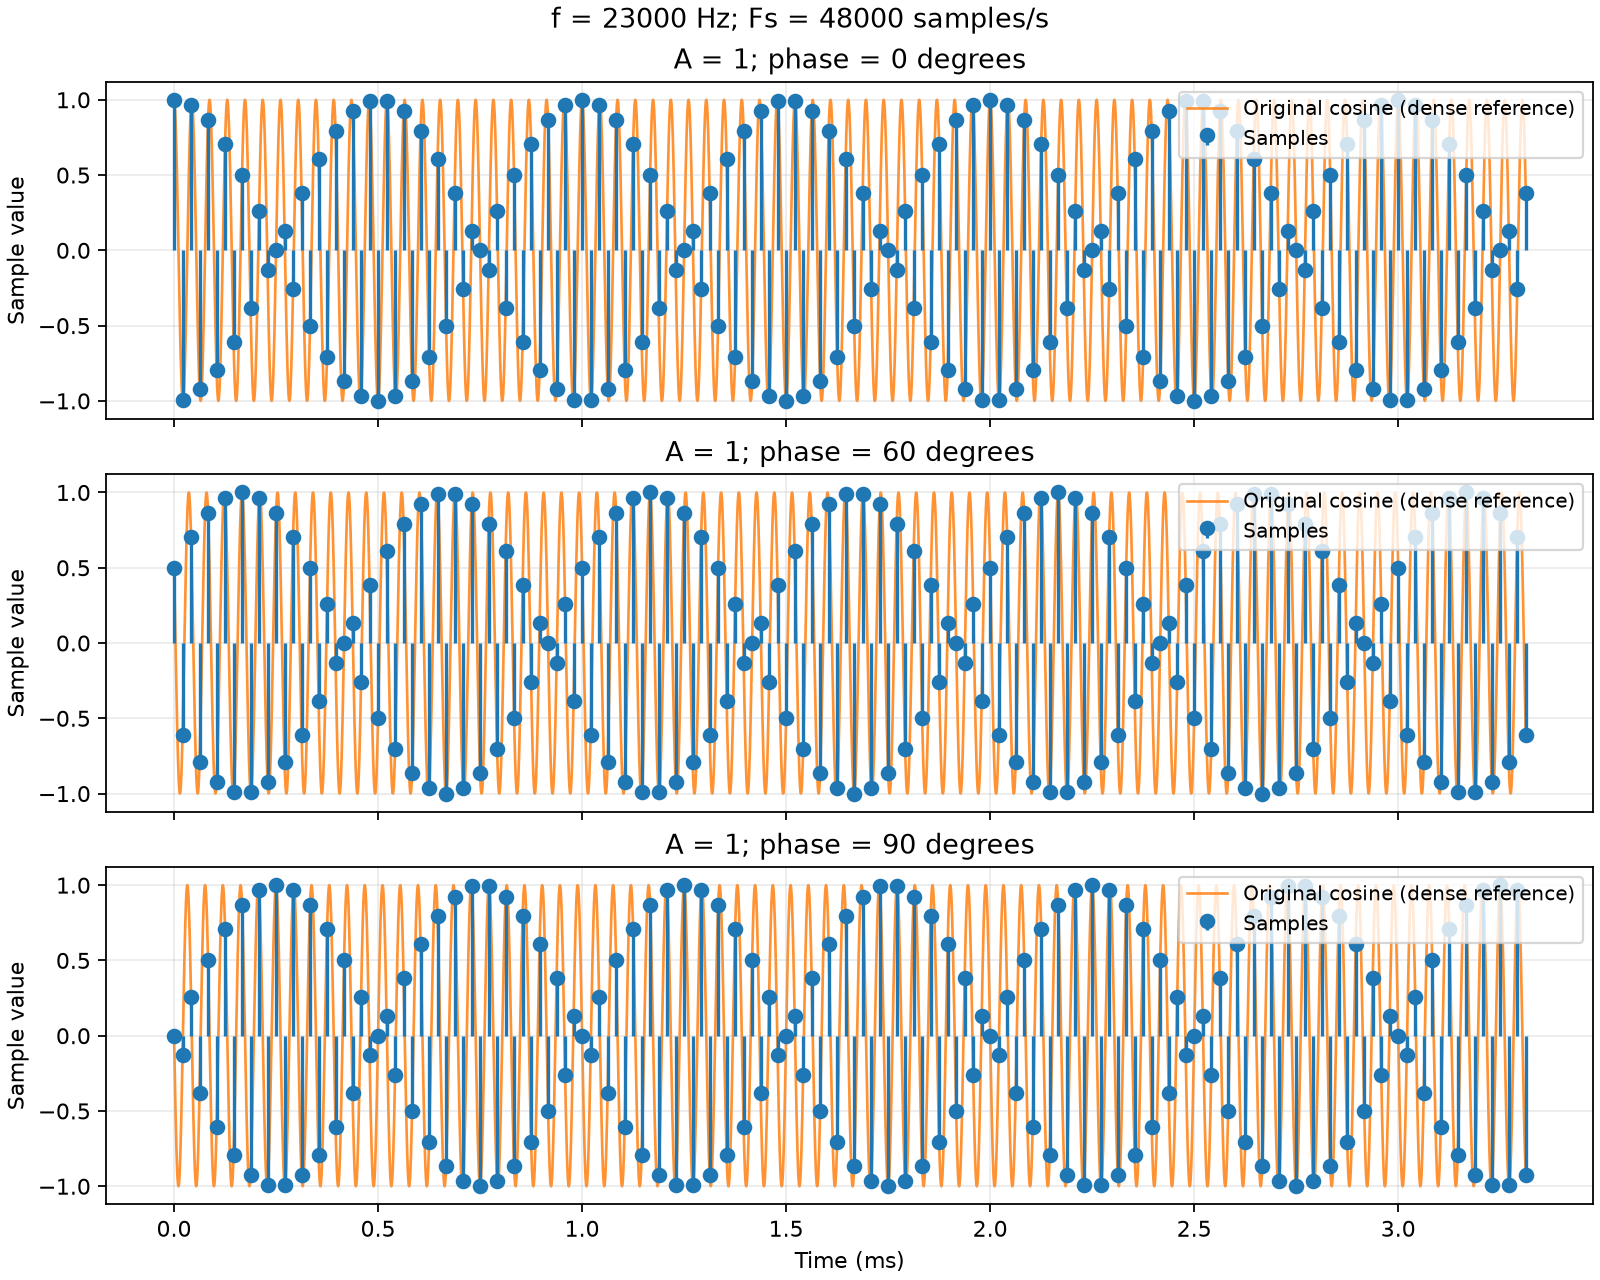
Now decrease the frequency to 23 kHz and keep Fs = 48 kS/s:
uv run labs/01/03-nyquist.py --f 23000 --reference --show --output-dir /tmp/dsp-below-nyquistThe angle step becomes 172.5°, not 180°. The points no longer alternate between only two positions. In particular, with an initial phase of 90°, the samples are no longer all zero. The --reference flag adds the original cosine, calculated on a dense time grid. To look at a few separate periods, add --samples 16.
On a long record, the points can make a pattern that looks like a slowly changing envelope. But the amplitude of the original sinusoid is constant: what changes is the position of the sampling instants relative to its maximums. From the appearance of sparse points, you cannot conclude that reconstruction is impossible.
You can also compare a third case: f = 24 kHz with Fs increased to 96 kS/s.
uv run labs/01/03-nyquist.py --fs 96000 --show --output-dir /tmp/dsp-higher-sample-rateYou get four samples per period and a step of 90°. Even with an initial phase of 90°, we now see 0, −1, 0, +1, …
What the Nyquist condition means
For a real signal with all its frequencies in the band from 0 to , we use the condition:
Strictly greater protects against our example with a sinusoid exactly at the limit. We assume that the input signal is limited to this band: a high Fs alone does not remove the effect of unknown out-of-band signals.
In the ideal model, a band-limited signal is reconstructed from the complete sequence of samples. This also applies to a 23 kHz sinusoid at kS/s: being near the limit does not by itself destroy information. In the lab, the record is finite, and in a device the measurements contain noise — these are additional limits. Straight lines between neighboring points do not give ideal reconstruction.
Why a device has a margin
Before the ADC, you need an analog anti-aliasing filter. A real filter cannot pass everything up to and immediately suppress everything just above : between the passband and the stopband there is a transition band. The frequency plan must leave space for the filter roll-off and give sufficient suppression of signals that can alias into the useful band.
This is why “we need a signal up to 20 kHz — so Fs = 40 kS/s” is not correct. Fs = 48 kS/s gives a limit of 24 kHz and some margin, but you must still check that a specific filter is sufficient. There is no single mandatory margin factor for all systems.
Self-check
At Fs = 48 kS/s and f = 24 kHz, we recorded the sequence 0.5, −0.5, 0.5, −0.5, …. The signal is , which is .
From this record, can you say that the amplitude of the original sinusoid was ?
All samples are equal to , where . One number is not sufficient to find two unknowns and . For example, , is possible — and an infinite number of other pairs.
Which pair of amplitude and phase, other than , , also gives the record ?
We look for pairs with . Possible pairs are and , and also, for example, and . At the Nyquist frequency, all these signals give the same samples.
We decrease the signal frequency to 23 kHz at the same kS/s. What is the angle step between samples now?
. This is less than half a turn. So after each two samples, the point does not come back exactly to its previous position: it is behind.
Do the samples of the 23 kHz signal still follow the sequence with a constant ?
The step is . So : the sign alternates, and the magnitude changes slowly. In samples, this factor goes through a full cycle. From the samples, you can again find both the amplitude and the phase — being near the limit does not destroy information.
In the next lesson, we separate sampling in time from quantization in amplitude: until now, we used ideal numbers for the sample values.
Next lesson: Quantization: how amplitude becomes a code.